2020-11-05 | Martin Weißbach | 5 min read
The Story of a Performance Collapse feat. Prometheus
Prolog
Scandio is in charge of the development of a logically centralized gateway for a renowned international manufacturer of household appliances in the SmartHome environment, which enables the exchange of information between household appliances and backend services, for example to remotely control an existing household appliance via app.
Several thousand household appliances are simultaneously connected to the gateway via a permanent TCP connection to enable bidirectional message flow.
Because the gateway has to meet the highest performance and availability requirements, performance metrics are created using regular load tests and compared with earlier figures from older development stages in order to detect performance regressions early on. One of these tests revealed that one of the services that make up the gateway placed a 5 times greater load on the CPU of its host than previous versions when new household devices (mocks) were continuously connected. Since this service is responsible for managing the TCP connections to the home devices and is essential for the exchange of messages, such a higher load on the CPU directly results in fewer home devices being connected per host instance.
CPU profiles of Go-Apps
Of course, we can’t just accept a performance loss of this magnitude, and so we began to investigate the causes. We were quickly able to identify the two specific software versions of the service called Websocket Manager (WSM), which holds the long-lasting TCP connections to the home appliances, which are worth investigating. Which means the last version with known low CPU load and the first version which is characterized by high CPU load. During the first test several versions were skipped. At this point, we would like to say that one version is not the same as one product increment. By using semantic release and corresponding build stages, the version of services developed by us is incremented in a much more detailed way.
The changeset between these two software versions was large and included some refactoring commits. After a first superficial search through the source code for the obvious, we were unsure which change would have such catastrophic effects. As a next step, we gave our WSM a debug endpoint [1], which can be activated in a configurable way, and started from tests on our notebooks. Among other things, this debug endpoint can be used to create and retrieve CPU profiles that can then be evaluated offline. Of course we had hoped to discover an outlier even with small numbers of household appliances. Our hopes were disappointed. The two software versions modified with the mentioned debug endpoint therefore had to be deployed on the load test stages in order to generate the CPU profiles from there during a running load test.
The results were somewhat shocking, because nobody had expected this:
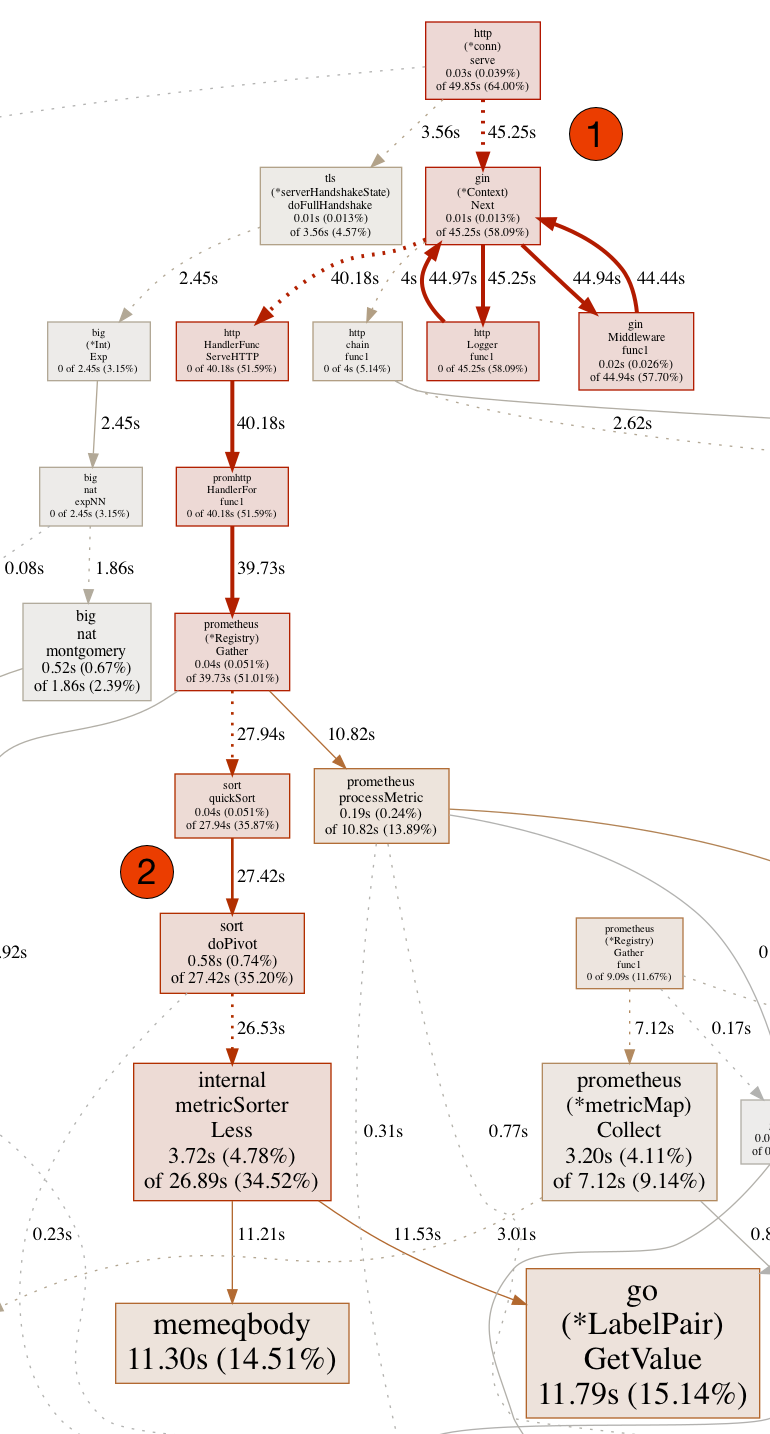
As can be seen in this section of the complete CPU profile, the HTTP endpoint (1) and the downstream middleware causes a high CPU load. In our Kubernets clusters we have set up Prometheus [4] via Helm [7] Chart [5,6] to make available various metrics of our cluster as well as our own services. As can now be seen from the trace, the Prometheus Library or its instance needs a lot of time at runtime to sort the metrics and insert updates (2) during the processing of an HTTP request.
The labels on Prometheus’ metrics are the problem
So the problem has to do with Prometheus and metrics generated at WSM. But at this point we saw all black cats passing the door from left to right. We had a similar problem with our old and now superseded implementation of the reverse proxy. The problem at that time was that we added the URLs including complete and not sufficiently exactly normalized paths as labels to the metrics, which Prometheus only tolerates up to a certain degree. What happens after that can be seen in the CPU profile above.
The search in the changeset started again and in fact we had previously only taken metrics for inbound requests at the WSM from its internal REST endpoint, but now also from the public endpoints for web socket connections. The changeover took place within the scope of using a dedicated middleware [2] for our gin servers [3] at WSM. This middleware adds the path as a label in a rather naive way: namely completely, including query parameters. When a household device opens a connection to Heimdall, the following URL including path is usually shown: wss://<domain>.<name>.com/websocket?appliance=<id>.
The query parameter is the problem because the Prometheus middleware builds the label “url” with the following content: /websocket?appliance=<id>.
From this follows immediately that each individual household device gets its own instance of the metric for, for example, the number of calls to the endpoint, but also for the status codes that are transmitted on the endpoint. This corresponds exactly to the observation revealed by the CPU profile: Prometheus can no longer insert new metric instances into the set of known instances on the client side with reasonable effort.
It should be noted that metrics can have more than one label. A label is the key for which there is a figure. The metric itself has a figure again. The figure of the metric itself is only increased if all figures of all labels are equal. Each permutation of the label figures is effectively a new instance of this metric. An example:

The metric defined in the Prometheus Client Library is called "http_request_counter" and adds up the number of calls and adds additional information like the concrete called path or the delivered status code. Each new path or status code that is not yet available as a figure results in a new instance of the metric at runtime, which is managed accordingly.
Our Solution
Fortunately, these findings can be used to provide a quick and viable solution. The used Prometheus middleware [2] allows the implementation of a hook function (similar to the Template Method Design Pattern [8], but not quite comparable to the classlessness of Go), in order to adapt the figure of the “url” label based on the inbound request to the own needs. This hook is explicitly intended for the normalization of paths, so it already addresses exactly the problem we have just identified. Our implementation of the hook then rather follows the principle of a crowbar: We always set the figure to “” (empty string). Why is this practical? The used Prometheus middleware [2] also adds the name of the handler as a label, which finally processes the request at the end of the middleware. This handler comes from us, i.e. we know the name and can therefore directly assign metrics to concrete endpoints.
Takeaways
- Starting from 150,000 different labels the Prometheus client library port for Go is no longer functional.
- Do not use labels whose amount of possible values you do not know or cannot estimate, or whose amount has not a fixed size.
- If you want to use middleware solutions for generating standard metrics for REST endpoints, see if and how paths and URLs are set as labels.
- Variant path elements that encode resource IDs, for example, will also sooner or later go to waste if they make it to the metric as a label value.
References
[1] https://github.com/gin-contrib/pprof
[2] https://github.com/zsais/go-gin-prometheus
[3] https://github.com/gin-gonic/gin
[4] https://prometheus.io/docs/introduction/overview/
[5] https://github.com/helm/charts/tree/master/stable/prometheus
[6] https://artifacthub.io/packages/helm/prometheus-community/prometheus
[7] https://helm.sh
[8] Gamma, Erich, et al. “Design patterns: Abstraction and reuse of object-oriented design.” European Conference on Object-Oriented Programming. Springer, Berlin, Heidelberg, 1993.
Scandiolife on Instagram.
Connect with us on LinkedIn.
Look what Scandio is tweeting.